It’s not possible to have profits without sales, but it is possible to have sales without profits.
A mistake made by many parts store owners or managers is to express store growth in terms of gross sales only. While it is reasonable to assume that an increase in sales means additional gross and net profits, this is not always the case. If real growth is to be measured, price increases and inflation must be taken into account. Rising expenses could reduce or negate any gains over the previous year. For example, if gross profits were 10 percent higher than in the preceding year but expenses also grew by eight percent, actual net gain is only two percent. Likewise, a 15 percent rise in sales may be less in terms of real growth if the increase was due in part to a four percent upward adjustment in prices by suppliers.
Awareness of sales performance along with personnel performance and expenses are indispensable to future success. Robust sales are not necessarily indicative of a healthy operation. Sales can be strong in a good economy, but the parts store can be plagued with problems like inventory mismanagement and personnel dilemmas. An upbeat business climate can often mask the true state of a store’s operations due to an abundance of customers. Internal problems are thus overlooked or ignored. These adverse conditions become increasingly obvious as sales are influenced by industry slowdowns or a recessionary period. It is soon evident that there is very little customer loyalty and virtually no solid customer base. Futile attempts are then made to attract business, but customer loyalty takes time to develop and a poor reputation for parts service is difficult to overcome.
Meaningful performance analysis dictates that all sources of sales be examined individually. Sales may have increased as a whole, but all areas may not have performed well. For instance, a decline in retail sales of 20 percent is certainly worth investigating to identify the underlying cause. Likewise, one would want to find the reason behind a sudden 30 percent increase in wholesale sales.
Sales and related financial information are analyzed more easily and with greater meaning when expressed in ratios. Ratios show the mathematical relationship between two similar amounts.
Ratios, however, are only as accurate as the information on which they are based. If the financial data is less than adequate or incomplete, the ratios will not impart any qualitative measure to these data.
Trend analysis is a good way to monitor and evaluate your performance. The process begins with the collection and assembly of relevant information in a useful arrangement. Usually, comparisons are made by matching the current month’s data with data from the same month of the previous year and by matching the current year-to-date data with the previous year’s year-to-date data.
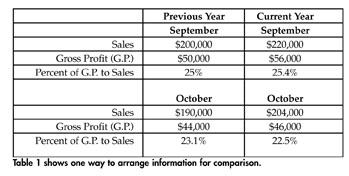
Table 1 shows one way in which you can arrange information for comparison. For this example, the two months (September and October) sales of the current year are compared to the same period and information of the preceding year.
Looking at September of the current year, sales and gross profit increased 10 percent and 12 percent, respectively, over the previous September, even though the ratio of gross profit to sales rose only 0.4 percent.
The October results were quite different. A 7.3 percent increase in sales resulted in a gross profit increase of only 4.5 percent (The figures are $14,000 and $2,000, respectively). Although sales were up, the ratio of gross profit to sales actually declined from the previous year.
Without analyzing each individual source of sales, you could only speculate as to the reason for the healthy gain in gross profit for September with a modest increase in sales, as opposed to October, which had a disappointing gross profit as a result of increased sales.
Table 2 lists the same comparisons, except with the amount and percent of change included for each.
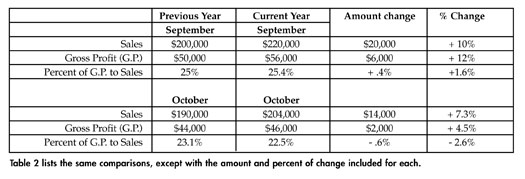
The primary concern when arranging trend figures should be providing, at a glance, a useful picture. The two tables are examples of information arranged in tabular form. While such tables indicate variances readily, it is more useful in some circumstances to use a graph.
Analyzing trends is important for store evaluation because in doing so, owners and managers can easily identify patterns, variances, strengths and weaknesses.
Consequently, as a management tool, analyzing trends helps managers in two ways. First, by comparing present results with past performance, it allows realistic, timely and attainable objectives to be established. And secondly, it assists in the detection and identification of poor-performance areas requiring review and possible corrective measures.