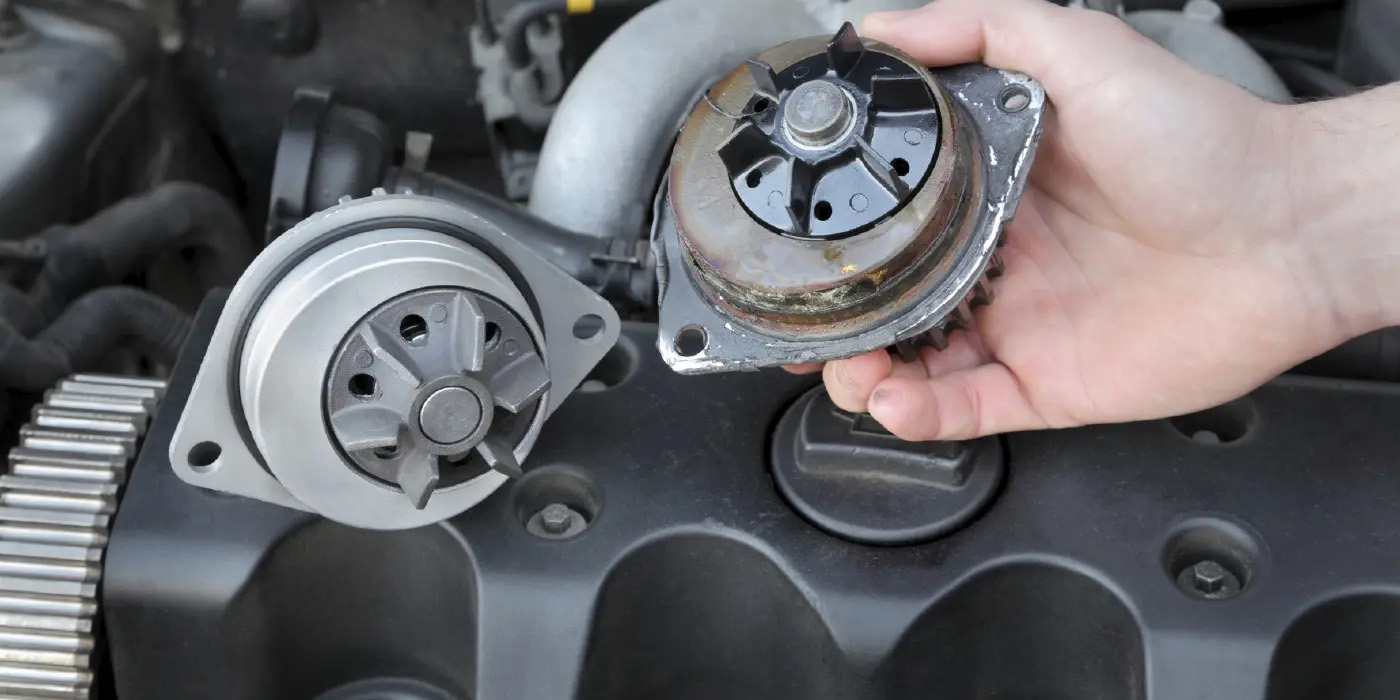
In June, IHS Markit released its annual estimate of vehicles in operation and the age of those vehicles. One of them was a new record, and one was a retreat.
The new record was for the average age of light vehicles in operation. The IHS estimate for 2021 was an average vehicle age of 12.1 years, which is an increase of two months over last year’s forecast. The retreat was in Vehicles In Operation, or VIO. That decreased from 281 million vehicles in 2020 to 279 million vehicles in 2021. According to IHS, that is the first decline in VIO since 2012. You can read more from IHS at https://news.ihsmarkit.com/prviewer/release_only/id/4759502.
Sales Slump
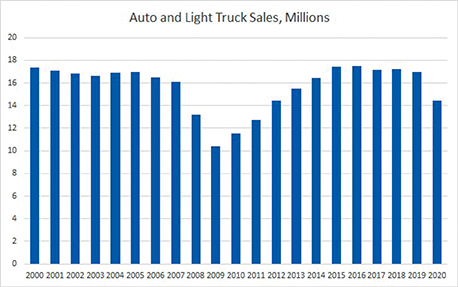
One easily measured economic time series can be cited as a culprit for both movements reported by IHS. That culprit is the decline in new-vehicle sales in 2020. For the year, new auto and light truck sales were 14.436 million, the lowest level since 2012. Using an online database such as TrendLens from the Auto Care Association or FRED from the Federal Reserve Bank of St. Louis, we can easily make a chart that tracks annual or monthly auto sales. While the final sales figure for 2020 probably exceeded many forecasts made at the beginning of the lockdown, nonetheless 2.5 million fewer new cars were added to the nation’s stockpile in 2020 than had been added in the previous five years. That will cause both a shortfall in VIO as well as an increase in the average age of the vehicles.
If you are keeping track of sales, note that monthly auto sales in the press are often reported at a “seasonally adjusted annual rate.” Annual rate refers to how many vehicles would be sold in a year if that month’s sales pace kept going for a whole year, while seasonally adjusted means that some attempt was made to smooth out known fluctuations that occur in sales during the year. Looking at it in this way adds a whole lot more volatility to the chart. It also points out how different this recession was compared to the last recession.
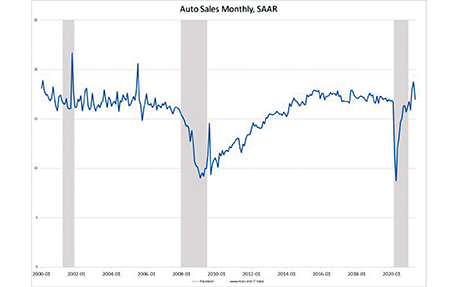
The shaded areas in the chart above show recessions. As you can see, the plunge in sales that occurred during the lockdown matched in-depth the plunge that happened during the Great Recession of 2008-2010. However, as soon as the lockdown ended sales snapped right back, unlike the Great Recession where sales stayed low for many years. The Great Recession was caused by massive financial problems that started in the housing sector – thus, it took a long time to get right. This recession was caused by restraints put in place to meet a non-economic problem, and when those restraints came off, the economy wasted no time in coming back.
The Sweet Spot
Looking back at auto sales from years past also brings to light some good news for the aftermarket. Many industry observers cite something called the “aftermarket sweet spot,” which is made up of vehicles that are variously described as six to 10 or six to 11 years old. These are vehicles that are out of warranty, entering the time period where OE equipment needs replaced, and the vehicles are still young enough that the owners are going to do more than just the bare minimum to keep them on the road. The number of vehicles in the “sweet spot” today are the ones that were produced six to 11 years ago. This next chart is just the annual sales data we showed earlier, only the period of six to 11 years ago is highlighted in green. (Green happens to be the color of money, but that is just a coincidence.)

What this chart readily shows is that the number of vehicles in the “sweet spot” for the past couple of years has been heavily influenced by the new-vehicle sales slump that occurred during the Great Recession. It was not until 2014 that new-vehicle sales exceeded the level in 2007. After that, there were five years of very high new-vehicle sales (2015-2020), cars that are just now getting old enough to be in the “sweet spot.”
Here is another way of looking at it. This next chart shows, for any given year, the number of new cars produced six to 11 years before. I call that the maximum size of the sweet spot, for in reality not all those cars produced six to 11 years ago are still on the road. Some were totaled in accidents, and some may have been scrapped due to costly mechanical problems. But the maximum will at least give us directional movements in the size of the “sweet spot.”
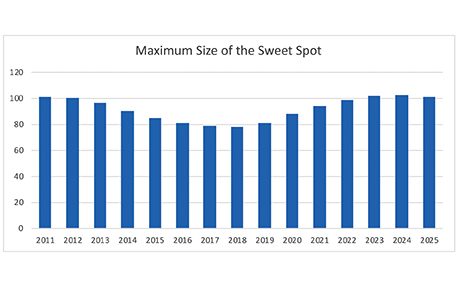
The “sweet spot” bottomed out in 2017-2018, as the full effect of the Great Recession sales slump took effect. But starting in 2019 and peaking in 2024, one by one those years of low sales will be replaced by years of high sales, and the number of vehicles in the “sweet spot” will grow.
The drop in the maximum size of the “sweet spot” in 2025 is because of the drop in 2020 sales. Of course, anything beyond 2025 depends on future sales. (So let’s hope that computer-chip shortage is solved.)
Medium and Heavy Sales
All the data so far has looked at light vehicles – automobiles and light trucks, with the latter including SUVs. What happened to medium- and heavy-duty trucks during the lockdown? Medium- and heavy-duty truck assemblies show more volatility year-over-year than is shown for light vehicles.
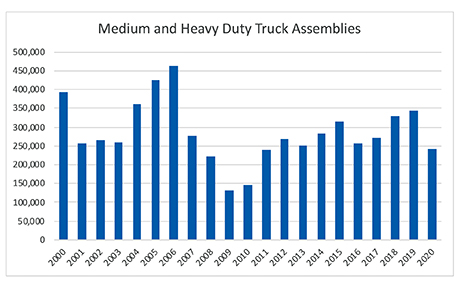
The drop in 2020 was almost 30% compared to 2019. The drop was magnified by the fact that 2019 had been the strongest year since 2006.